Running ThreatGet
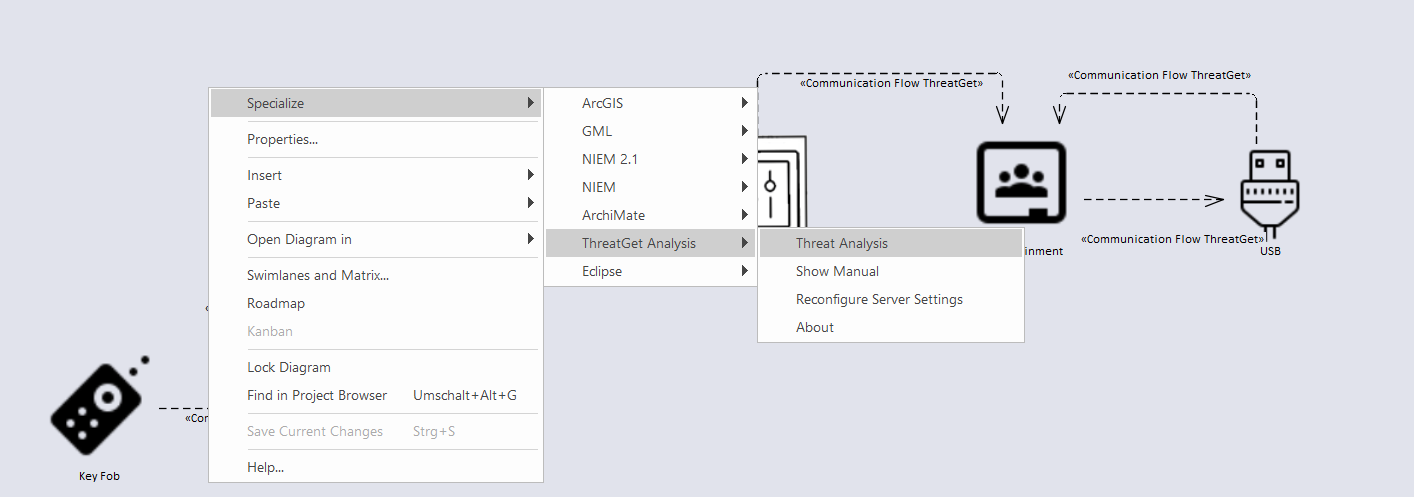
To demonstrate the ThreatGet operation, use the default ThreatGet Diagram with Example or the model example. In the Project Browser, right-click either on the package or the diagram itself and then select Specialize ➺ ThreatGet Analysis ➺ Threat Analysis. In our case, the package is called ThreatGet Example.
The Threat Analysis creates a new package where analysis details are stored. It is visible in the Project Browser and can be deleted when it is no longer needed. Further, a new tab titled Threat Analysis is opened.
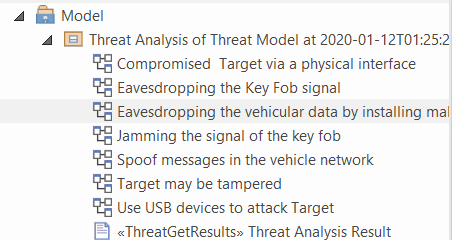
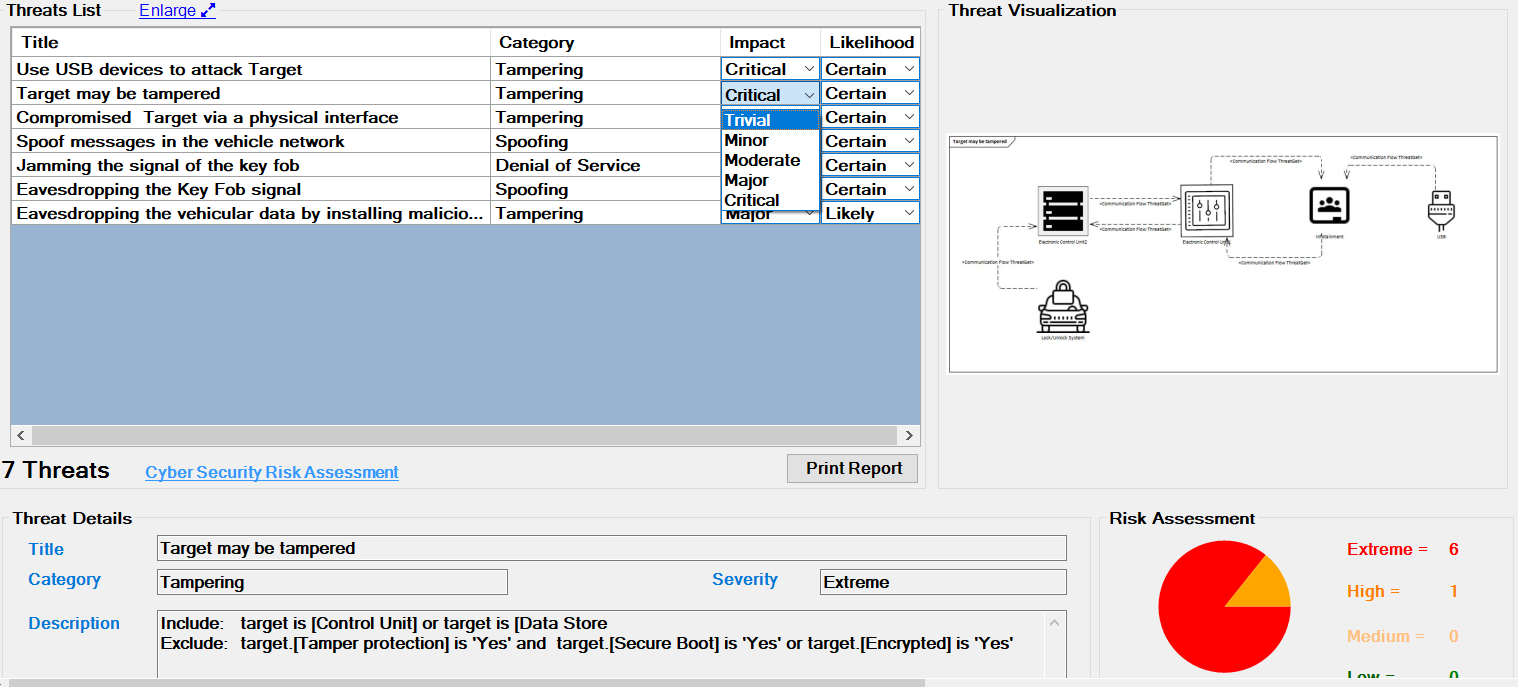
Threat Analysis generates a list of all the potential threats of overall affected elements in the given example model, as shown below.
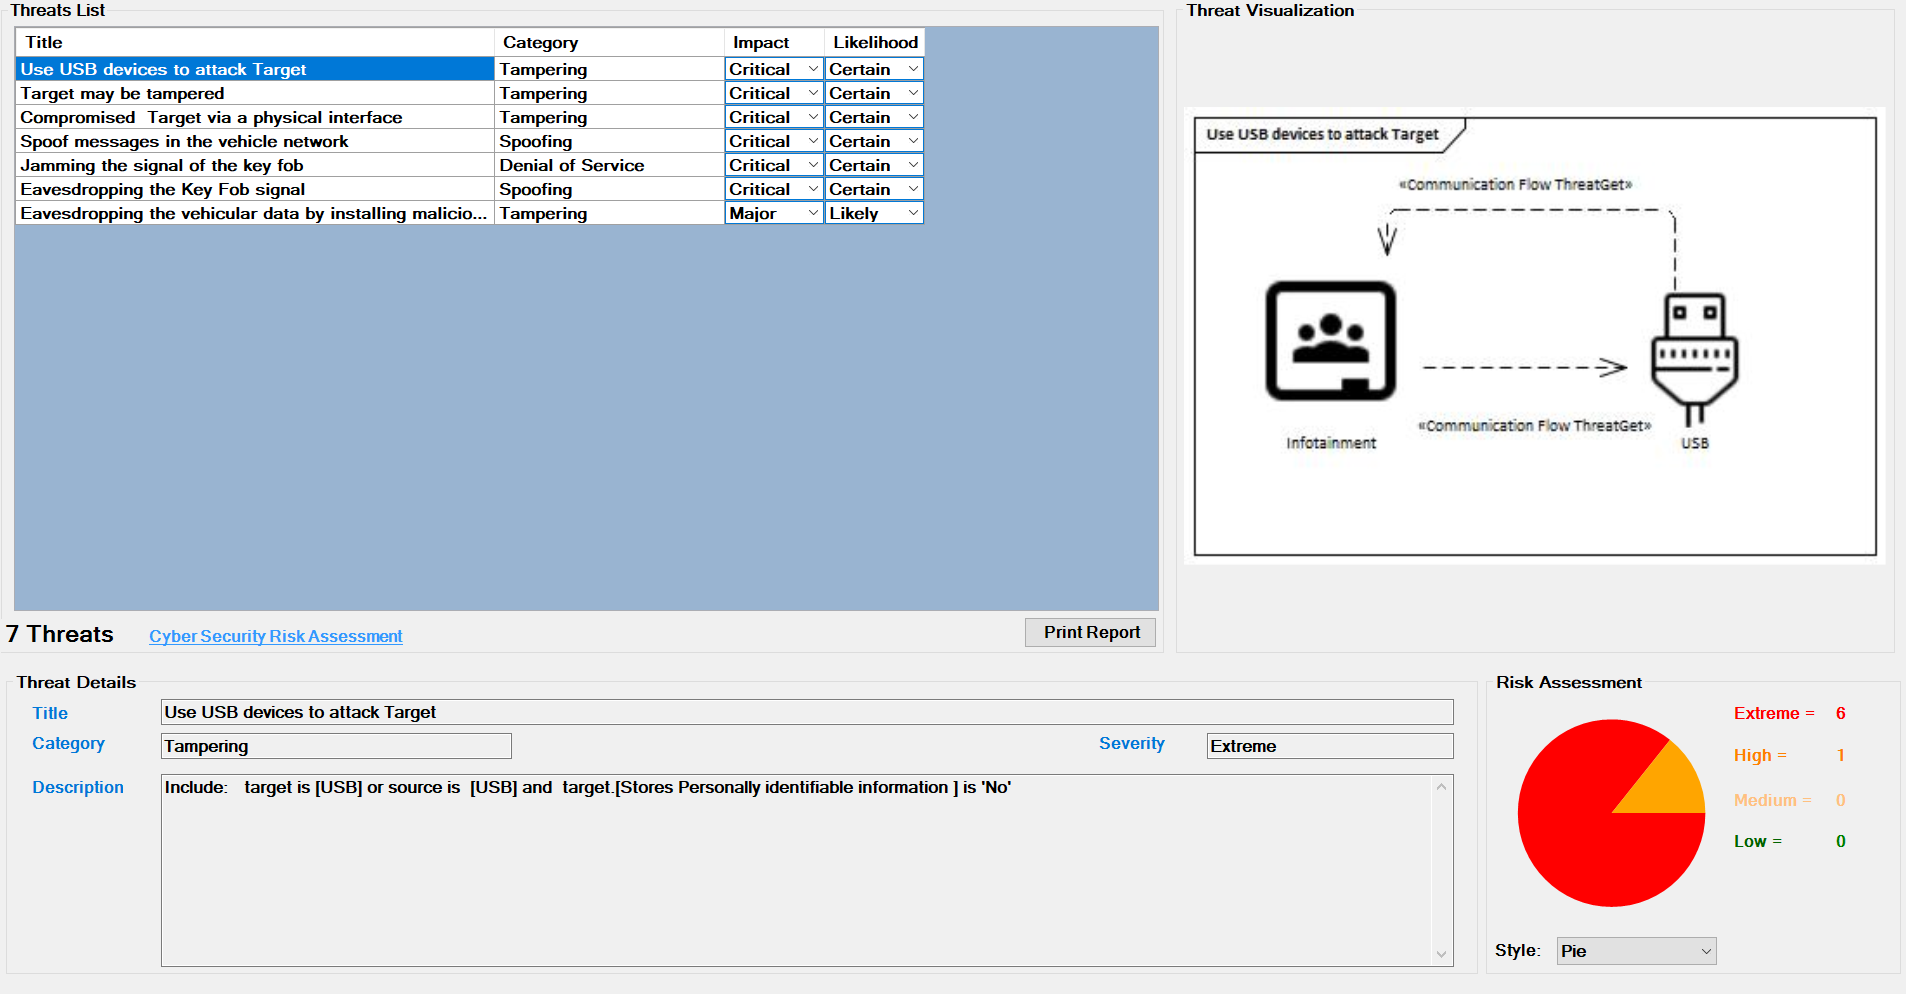
Scroll in the Threat List table to reveal Impact and Likelihood values. On the right side, there is a diagram that depicting the selected threat. If several threats are detected on the same elements, they are all in the diagram. All related details for each identifiedthreat can be viewed at the bottom section represented as Threat Details.
Each Threat is categorized based on the STRIDE model:
- S – Spoofing of user identity
- T – Tampering
- R – Repudiation
- I – Information Disclosure
- D – Denial of Service
- E – Elevation of Privilege
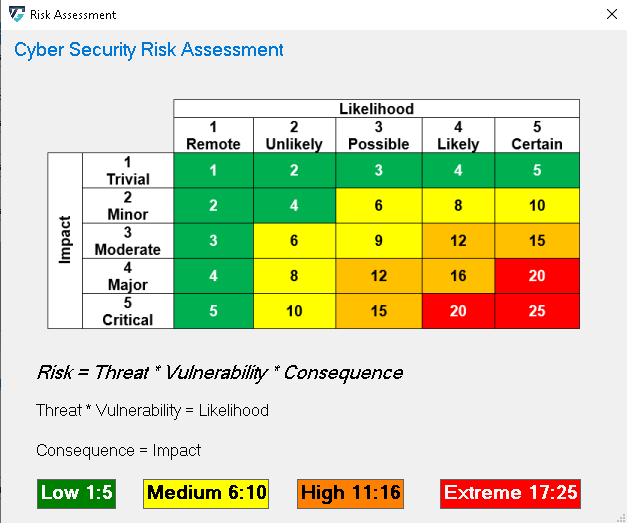
Each Threat is further annotated with two additional parameters, Impact and Likelihood. From these values the risk severity is calculated which is required for the corresponding Risk Assessment as shown below.
The risk severity is calculated as Impact x Likelihood. An explanation can be accessed by clicking on the Cyber Security Risk Assessment link. The dialog is show below.
The default value for Impact and Likelihood is determined by the rules. The user can change these values.
The five available values for Impact in ascending order of their strength are Trivial, Minor, Moderate, Major, and Critical.
Similarly, the five available values for Likelihood in ascending order of their strength are Remote, Unlikely, Possible, Likely, and Certain.
Assessed Severity of Risk can be categorized in four levels, the ascending order of levels is Low, Medium, High, and Extreme.
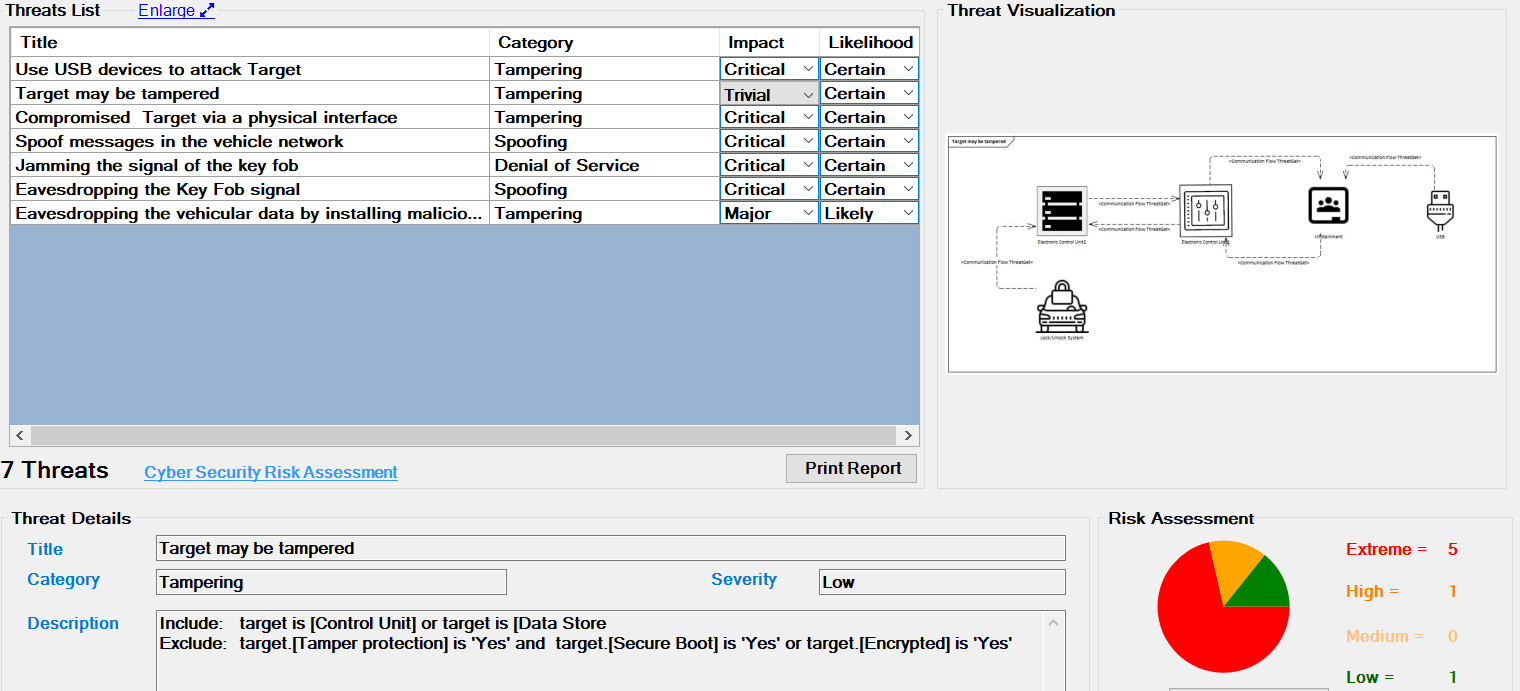
The change immediately affects the severity displayed below.
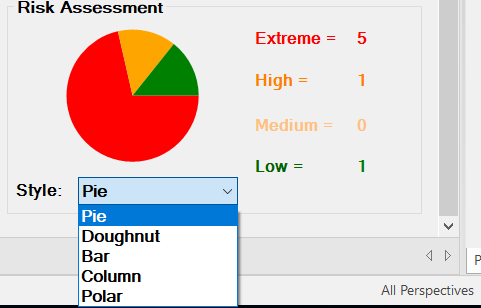
It further affects the chart on the bottom right side of the screen. Five chart styles are available for representing the distribution of threats based on the Severity of the Risk, as shown below.
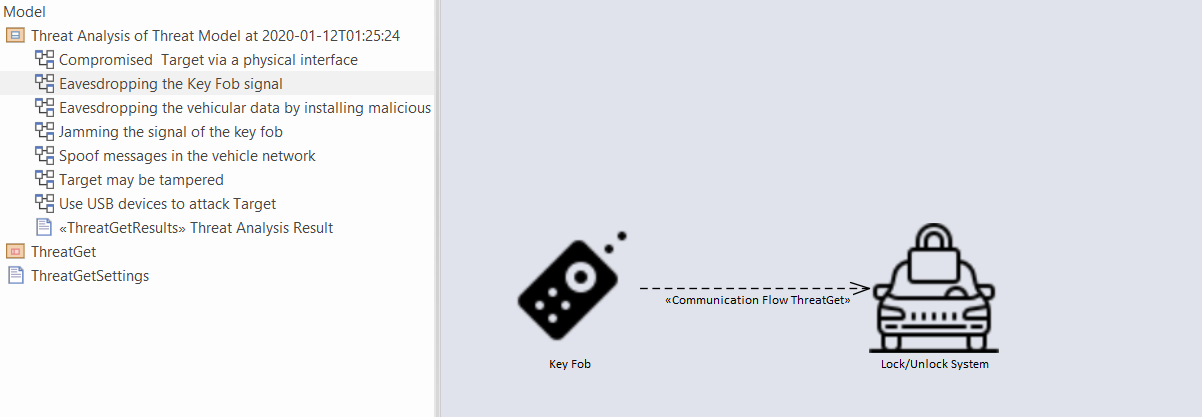
The diagrams on the right are also available in the analysis package.
Threats corresponding to each communication flow can be viewed by expanding the subpackage in the Threat Analysis package in the Project Browser. The diagram below represents the threats corresponding to communication flow Key Fob to Lock/Unlock antenna. Similarly, threats corresponding to any communication flow in the project browser can be viewed.
Finally we can print a report of the generated threats.